LoadStrike /Transaction load testing
Measure API-to-worker completion with LoadStrike transaction load testing. Match shared IDs, inspect timeouts and duplicates, and follow a practical example.
Direct answer
What is transaction load testing?
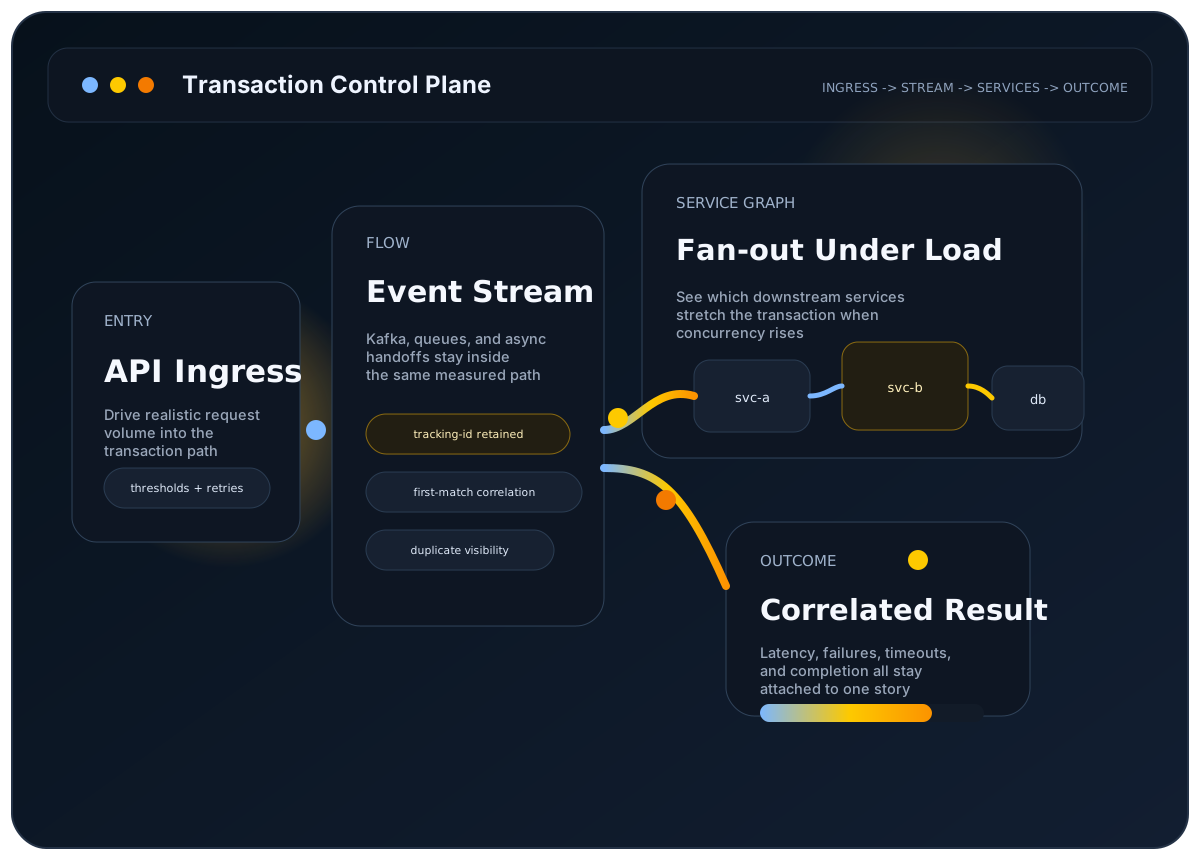
Transaction load testing measures whether the full business workflow completed under load, not just whether the first request returned quickly. That means the test follows the path across APIs, queues or streams, browser steps, and downstream services until the outcome is actually visible.
LoadStrike is built for that model. It keeps the transaction explicit in code, matches source and destination activity through a shared tracking value, and reports correlated latency, timeouts, duplicates and failures in one self-hosted runtime. Your selected completion event defines the measured boundary.
For an order API, HTTP 202 tells you that a request was accepted. A completion event emitted only after the worker has finished the required business action answers the next question: did the order finish within the target window? LoadStrike lets you test those two boundaries together.
The user problem
You need to know whether the business workflow actually completed under load, not just whether the first request returned.
Why it matters
A fast ingress hop can still hide delayed consumers, failed downstream work, or browser-driven side effects that matter more than the first response time.
Best-fit workloads
Where this workload usually needs transaction visibility
API to queue to worker paths
Track a request from ingress through async processing until completion is visible.
Browser plus backend flows
Keep the page journey and the downstream service path in one measured transaction.
Service graphs with side effects
Follow retries, fan-out, and downstream confirmations without stitching reports later.
Who this is for
Engineering, QA, platform, and performance teams whose real performance question depends on downstream completion instead of ingress latency alone.
Why endpoint-only testing breaks down here
Endpoint-only tests stop too early when the workflow continues into queues, workers, service fan-out, or browser-driven side effects. A fast first hop can still hide delayed or failed completion later in the system.
How LoadStrike fits
LoadStrike models the transaction as a scenario, keeps APIs and downstream endpoints in the same runtime, and returns HTML, CSV, TXT, and Markdown reports.
What to expect
Verified LoadStrike fit points
- Self-hosted runtime built for transaction-aware testing.
- Supports APIs, queues and streams, browser journeys, and downstream services in one model.
- Public SDK surfaces for C#, Go, Java, Python, TypeScript, and JavaScript.
- Correlated reporting with timeout and duplicate visibility plus grouped analysis.
Resources
Worked example: an API request to a Kafka completion event
This is a configuration walkthrough, not an executed benchmark or a customer result. Use an owned staging order API and a Kafka completion topic. Native Kafka endpoints need an eligible Pro or Enterprise runner key; confirm the selected SDK and execution mode support correlation before sending load.
POST /orders with X-Correlation-Id: order-001. The default HTTP source tracks the request payload, so use header:X-Correlation-Id as its selector. Keep the 202 acceptance response separate from the completion outcome.
Have the application copy order-001 into the trackingId field of its orders.completed message. Emit this event only after the required work succeeds. Use a separate observer consumer group so the test does not take work away from application consumers.
Set the Kafka destination selector to json:$.trackingId. The two selectors can read different fields, but their values must identify the same attempt. Use a fresh ID for each generated attempt and preserve its exact casing; repeating IDs can make retries and separate attempts ambiguous.
For example, choose a 5-second HTTP timeout and a 30-second CorrelationTimeout, with TimeoutCountsAsFailure enabled. These are illustrative settings, not measured targets. Verify one smoke completion is observed before increasing traffic; a connected consumer alone does not establish readiness.
Read matched latency percentiles together with timeout, source-error and unmatched-destination counts. A healthy matched P95 does not account for requests that never matched. Check duplicate tracking values against application outcomes; they do not prove duplicate business processing.
Resources
Interpret a transaction performance test correctly
Correlated latency uses the timestamps supplied by the selected endpoints. Kafka destination records can carry their producer timestamp rather than the time a test consumer observed them. Check timestamp settings and clock alignment, and retain application timestamps if the question is client-visible elapsed time or worker execution time.
Keep matching rules and timeout handling explicit when interpreting late, duplicate or unmatched events.
Set a destination GatherByField when a business dimension should have its own counts and latency percentiles; inspect each group and review ungrouped timeouts and failures as well.
Use documented scenario, step or metric predicates over the stats your SDK actually supplies. Verify that the chosen gate includes the missing or failed work that matters to the workflow.
Record versions, workload, environment, achieved rates, outcomes and repeated runs. Publish measured results only with their supporting artifacts; configured load is not achieved throughput.
Resources
Docs and examples
These pages define the transaction model in product terms and show how it is implemented in the docs.
Choose the API workload and response checks before adding the downstream completion condition.
Defines the workflow model behind LoadStrike scenarios.
Shows where request-centric tests stop helping.
Build one simple request-step scenario and run it.
Open the sample repository and high-signal docs entry points.
Common questions
Common questions
How is transaction load testing different from endpoint testing?
Endpoint testing measures the first request or protocol hop. Transaction load testing measures whether the full workflow finished across the systems that matter to the business, which is a broader and more operationally useful question in distributed systems.
Can a transaction start in one protocol and finish in another?
Yes. LoadStrike is designed for workflows that begin at an API or browser step and then continue through queues, streams, or downstream services before completion is visible.
Which LoadStrike surfaces support transaction testing?
The site documents transaction-aware workflows across HTTP, Kafka, RabbitMQ, AWS SQS, Azure Event Hubs, NATS, Redis Streams, delegate-backed Push Diffusion and custom streams, and Playwright or Selenium browser journeys. Check the selected SDK and plan for each endpoint and execution mode.
Does a matched completion message prove the business operation succeeded?
A match proves that the configured source and destination carried the same tracking value. Define the destination so its event represents the required successful action, or validate the application outcome separately. Matching an acceptance or progress event would measure that earlier boundary instead.
Why should completion latency be reviewed with timeout counts?
Matched latency percentiles describe events with a recorded match and latency. Work that never reaches the selected completion event can time out without appearing in that latency distribution. Review timeout and failure counts beside latency before deciding that the transaction performance test passed.
Related
Related documentation
Start with the implementation details that match this page.
A transaction in LoadStrike is the full workflow you care about, not just one request. Read this page first if your workload crosses systems.
Compare endpoint-only testing with full transaction testing so you can measure the whole downstream workflow instead of just the first request.
Tracking selectors tell LoadStrike where to find the ID that ties one workflow together. Use them when the source and destination need to be matched in the report.
Configure Kafka load and performance testing with LoadStrike: publish and consume records, preserve tracking IDs, and observe downstream completion.
This page explains how to read a LoadStrike report. Use it when you want to know what each section means and where to look first.
Related
Related comparisons
Use these comparison pages if you still need a tool-level decision.
Compare LoadStrike and Apache JMeter for async completion, JMS, browser execution, reports and self-hosted testing, including setup and licensing requirements.
Compare LoadStrike and k6 for APIs, Kafka, browser tests and async completion, including correlation requirements, extensions and hosting tradeoffs.
Related
Related integrations
Connect the run output to the observability backend your team already uses.
See how the LoadStrike Datadog sink fits into transaction-aware, self-hosted load testing workflows.
See how the LoadStrike OTEL Collector sink fits into OpenTelemetry-oriented reporting workflows.
Related
Next steps
Keep moving with the most relevant follow-up pages.
See how the transaction model applies to async systems.
Connect APIs, browser steps, and downstream completion in one page.
Read the matching article on designing scenario boundaries.
Next step
Next step
Start with one order request and its verified completion event. LoadStrike connects the two through a shared ID, so your team can inspect completion latency, missing matches and duplicates in the same run.