Published 2026-04-19 | Updated 2026-04-19 | LoadStrike Editorial Team | Reviewed by LoadStrike Team
A balanced comparison of LoadStrike and Apache JMeter for self-hosted teams that need to test APIs, browser journeys, and event-driven transaction paths.
Compare LoadStrike and Apache JMeter across scenario design, protocol coverage, downstream correlation, browser workflows, reporting, and self-hosted operations.
Direct answer
Direct answer
LoadStrike is the better fit when the team needs one self-hosted runtime for APIs, browser journeys, queues, and downstream completion reporting instead of a broad request-generation toolkit centered on test-plan composition.
Apache JMeter remains a valid option for teams that already operate mature JMeter estates, but LoadStrike is more purpose-built when the real question is whether the full business transaction still completes correctly once the first request has entered the rest of the system.
LoadStrike is usually the better fit when
The performance question depends on what happened after ingress, such as queue completion, downstream service confirmation, or browser-driven side effects.
You want one self-hosted runtime for APIs, browser journeys, brokers or streams, and grouped transaction reporting instead of composing that picture from multiple JMeter-side conventions.
The team needs the same scenario, threshold, and reporting model across multiple SDKs and mixed transport types.
Apache JMeter is still worth validating when
Your organization already has a mature Apache JMeter estate and the main job is still broad request generation rather than transaction-level diagnosis.
You depend on the surrounding JMeter plugin and listener ecosystem and are comfortable assembling downstream visibility outside the tool runtime itself.
The workload remains mostly request-centric, so the flexibility of an established JMeter practice matters more than a tighter transaction model.
Who this is for
Apache JMeter is familiar to many performance teams because it offers a broad ecosystem and a long operational history. LoadStrike is aimed at a narrower but increasingly common problem: workloads where one business transaction crosses APIs, browser steps, and asynchronous systems and needs to be explained through one reporting model.
Why teams compare these tools
Apache JMeter gives teams a broad, familiar request-generation ecosystem. LoadStrike is more focused when the workload must be explained as one transaction across browsers, brokers, and downstream completion.
How LoadStrike fits
Choose LoadStrike when the test must explain whether a business transaction still completed across browsers, APIs, brokers, and downstream services instead of only proving that requests were emitted successfully.
Resources
LoadStrike pages to review first
Use these pages to validate the LoadStrike side of the comparison before running a proof of fit.
Official user manual for checking current JMeter usage guidance.
Short verdict
Short verdict
Apache JMeter gives teams a broad, familiar request-generation ecosystem. LoadStrike is more focused when the workload must be explained as one transaction across browsers, brokers, and downstream completion.
Choose LoadStrike when...
Choose LoadStrike when the test must explain whether a business transaction still completed across browsers, APIs, brokers, and downstream services instead of only proving that requests were emitted successfully.
Choose Apache JMeter when...
Choose Apache JMeter when a mature JMeter practice, broad request-generation flexibility, and existing plugin-heavy workflows matter more than moving to a more opinionated transaction-aware runtime.
Area
LoadStrike
Alternative
Primary use case
Scenario-driven load testing for APIs, event systems, browser journeys, and clustered execution under one runtime surface.
General-purpose load generation with a broad plugin ecosystem and strong familiarity in request-centric performance programs.
Cross-system coverage
Built for HTTP plus broker and stream transports with one scenario and reporting contract.
Can target many protocols, but full-path business transaction modeling often requires more custom composition.
Correlation depth
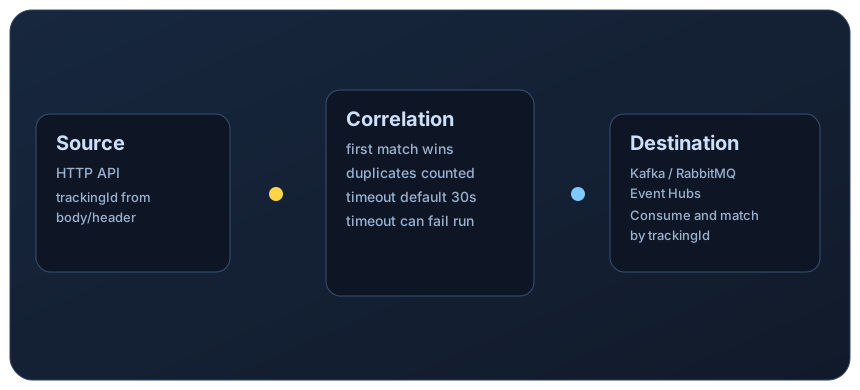
Built-in source-to-destination matching, grouped analytics, duplicate visibility, and timeout accounting.
Usually depends on custom scripting, external observability, or post-run analysis to reconstruct downstream outcomes.
Browser strategy
Playwright journeys can sit inside the same scenario and threshold model as service traffic.
Browser testing is usually handled as a separate workflow from the main JMeter test plan.
Strong plugin and listener ecosystem, but diagnostic depth depends heavily on how the test plan is assembled.
Self-hosted operations
Self-hosted runtime with one scenario model, one report surface, and consistent mixed-transport support.
Operational control depends on team conventions and the JMeter stack assembled around the test estate.
Decision considerations
Where LoadStrike Fits Best: LoadStrike is a better fit when performance engineering needs to explain full transaction behavior across systems, not only request emission. Teams that need source-to-destination correlation, browser journeys, and clustered execution under one programming model usually benefit from that tighter focus.
Where Apache JMeter Fits Best: Apache JMeter remains a credible choice for teams that already have a mature JMeter practice, need broad protocol coverage through its ecosystem, and are comfortable maintaining a test estate built around test plans, listeners, and custom extensions.
Operational Tradeoff: The practical tradeoff is flexibility versus opinionation. JMeter offers a very large ecosystem and many established patterns, while LoadStrike offers a more opinionated runtime for teams that want consistent scenario, correlation, and reporting behavior across language SDKs and transports.
Decision Signal: If the main question is whether a full business transaction still completes correctly and on time once it enters downstream queues and services, LoadStrike is the more purpose-built option.
Common questions
Common questions
When should a team choose LoadStrike over Apache JMeter?
Choose LoadStrike when the workload crosses APIs, browsers, brokers, and downstream services and the team wants one self-hosted runtime to explain whether the full business transaction still completed. That is different from simply generating protocol traffic and stitching the rest of the diagnosis together after the run.
When does Apache JMeter still make sense?
Apache JMeter still makes sense when the team already has a mature JMeter practice, relies on its large plugin ecosystem, and is mostly solving request-centric performance questions. In that situation, the operational familiarity of the existing estate may matter more than moving to a transaction-focused runtime.
What is the biggest architecture difference between LoadStrike and Apache JMeter?
The biggest difference is that LoadStrike treats transaction correlation and downstream completion as part of the runtime contract, while JMeter usually needs more custom composition around listeners, scripts, and external observability to reconstruct what happened after the first request was accepted.
Related
Related documentation
Start with the implementation details that match this page.
A balanced comparison of LoadStrike and Apache JMeter for self-hosted teams that need to test APIs, browser journeys, and event-driven transaction paths.