
Short answer
Event-driven load testing with LoadStrike helps teams verify asynchronous workflows by connecting the source request or message to downstream completion, timeout handling, and grouped report evidence.
Discover how event-driven load testing enhances performance for microservices, ensuring seamless integration and reliability across complex workloads.
Event-driven load testing with LoadStrike helps teams verify asynchronous workflows by connecting the source request or message to downstream completion, timeout handling, and grouped report evidence.
This article is useful for teams implementing microservices architecture or transitioning to event-driven systems, as well as those seeking to optimize performance testing.
Start with the article for context, then move into the linked docs and category pages for the concrete runtime, protocol, or reporting setup.
As organizations evolve towards microservices architectures, the complexity of testing increases. One of the key testing methodologies gaining traction is event-driven load testing. This approach not only addresses the unique challenges posed by microservices but also enables teams to ensure performance and reliability across multiple endpoints.
Event-driven load testing specifically focuses on how systems respond under load, particularly when relying heavily on asynchronous processes and message queuing systems. By simulating real-world events and traffic flows, teams are better equipped to handle sudden spikes and user requests effectively.
Organizations are increasingly adopting microservices for their agility and scalability. However, the interconnectivity of microservices introduces challenges that necessitate advanced testing solutions. To ensure a robust and performant system, teams must leverage a comprehensive load testing tool capable of handling the nuances of event-driven architectures.
A practical event-driven load testing article should also explain how a team moves from a first HTTP check to a repeatable performance workflow. With LoadStrike, the useful starting point is a named scenario, a named step, a clear response decision, and a report that shows request counts, failure rate, latency, and bytes before the team adds more transports or downstream checks.
That context matters for teams comparing load testing tool, performance testing tool, load testing software, performance testing software, and load and performance testing tool. The important buying question is not only whether the tool can send traffic, but whether engineers can review what happened after the run, keep the test close to the service code, and explain failures without creating a separate observability project for every performance test.
For API teams, the path usually starts with one endpoint and one realistic payload. The next useful layer is transaction evidence: what request started the work, which downstream step completed it, how long the whole path took, and which part of the workflow created the failure or delay. LoadStrike is designed so that progression can stay inside the same scenario and reporting model.
The same approach helps mixed engineering groups because the supported SDK languages let each team use the language they already maintain. A platform team can keep Go or Java examples close to service code, a QA team can use TypeScript or JavaScript for browser journeys, and a backend team can keep C# or Python scenarios near their application tests while sharing the same LoadStrike concepts.
In traditional load testing, the focus often lies on individual components or services. However, in an event-driven architecture, it's critical to understand how messages flow through different services. Source-to-destination correlation allows teams to trace a request from the initial call to its ultimate destination, providing visibility into the entire process and identifying potential bottlenecks or failures.
By utilizing a load testing software that emphasizes this correlation, teams can gain insights into how each part of the architecture interacts. This visibility is crucial when troubleshooting performance issues.
Timeouts can be a significant concern in event-driven architectures, where services must wait for messages from other components. This creates scenarios where slow responses can lead to cascading failures. A robust load and performance testing tool must address timeout scenarios through realistic simulations.
Setting appropriate timeout values while testing helps teams simulate real-world conditions, ensuring that the system remains resilient even under stress. By correctly configuring timeouts, teams can better gauge system performance and reliability.
When testing microservices, it's important to analyze not just individual service performance but also how they work together. Grouped reporting consolidates data from various services, enabling teams to view performance metrics in the context of a broader workflow.
Such reporting aids in pinpointing issues that may arise from interactions between services rather than from a single component. Implementing grouped reporting within your performance testing software fosters a comprehensive understanding of system behavior.
Event-driven load testing can be highly beneficial across various scenarios, including APIs, browser workflows, event streams, and transaction-focused performance testing.
For instance, in an API-driven service, simulating a high volume of requests concurrently can reveal how effectively the service manages load and complies with set timeouts. Additionally, for browser workflows that depend on multiple microservices, understanding the combined performance resilience helps optimize user experience.
Use these proof assets to verify report output, examples, and methodology before turning the article into a scenario.
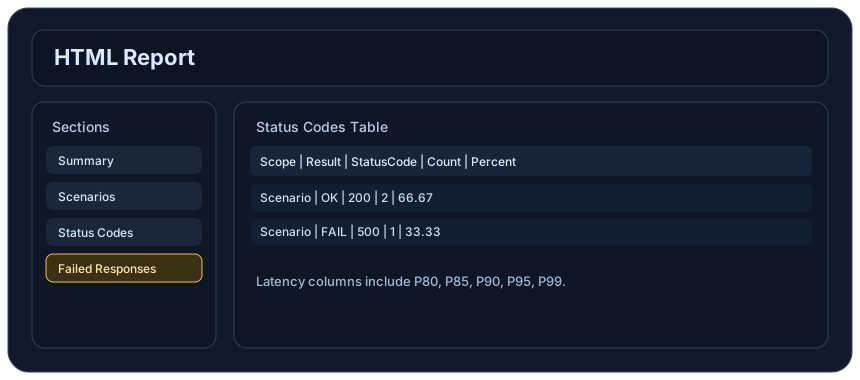
Review the HTML reports, CSV, TXT, Markdown, metrics, and report artifacts available after a run.
See how public benchmark evidence should be scoped before results are published.
Start from the examples hub before mapping the article topic into a runnable scenario.
These links keep the article connected to the docs, category pages, and comparisons that help engineers act on the topic.
Understand async and broker-backed workflow coverage.
Learn the complete workflow model behind LoadStrike.
Read the core transaction definition.
Follow the official LoadStrike activity connected to product updates and performance testing guidance.
Follow the official LoadStrike LinkedIn activity for product updates, engineering notes, and related performance testing posts.
These answers stay on the page so readers can scan the practical questions that usually come next.
Event-driven load testing simulates real-world events to verify how systems perform under load in an ecosystem reliant on asynchronous processes and message queues.
LoadStrike as a code-first load testing and performance testing tool provides source-to-destination tracking, timeout management, and grouped reporting tailored for microservices.
LoadStrike supports various SDK languages, including C#, Go, Java, Python, TypeScript, and JavaScript.
It provides comprehensive insights into how requests traverse through services, enabling teams to pinpoint performance bottlenecks effectively.
Go deeper with the docs, category pages, examples, and comparison guides connected to the distributed-system patterns discussed in this article.