
Short answer
LoadStrike allows teams to generate portable performance test reports that can be directed to observability destinations, with clear diagnostics for any delivery issues.
Explore how LoadStrike's local report artifacts empower engineering teams to analyze performance while providing transparency about reporting delivery.
Explore how LoadStrike's local report artifacts empower engineering teams to analyze performance while providing transparency about reporting delivery.
LoadStrike allows teams to generate portable performance test reports that can be directed to observability destinations, with clear diagnostics for any delivery issues.
This article is best read during your test planning phase or when analyzing post-test results to maximize report utilization.
Start with the article for context, then move into the linked docs and category pages for the concrete runtime, protocol, or reporting setup.
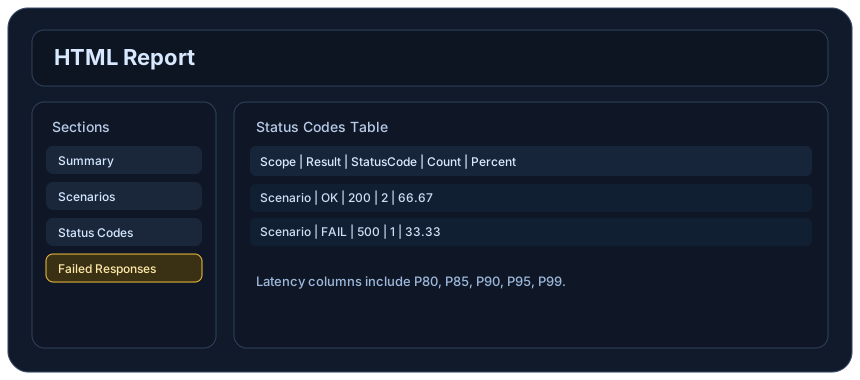
LoadStrike's feature of local report artifacts allows teams to capture detailed insights from their load tests and produce performance test reports that serve as portable evidence of system behavior under stress. This functionality enables users to generate comprehensive reports that provide metrics such as latency distributions, failure rates, and scenario outcomes, making it easier to analyze system performance and identify bottlenecks or failures in the workflow. Each report is produced at the end of a performance test and can be configured to either exist in local form or be sent to defined external reporting sinks.
The practical benefit of using LoadStrike's local report artifacts lies in their ability to deliver not only performance insights but also visibility into the reporting process itself. With the inclusion of diagnostics related to reporting delivery, users can easily see if their data has been successfully transmitted to chosen observability tools such as Grafana, CloudWatch, or Prometheus. This feature is particularly critical in scenarios where understanding the completeness of collected metrics is essential for post-test analysis. If any issues arise in the delivery, LoadStrike provides explicit warnings, allowing teams to swiftly address any concerns and ensure data integrity.
For engineering teams aiming to conduct thorough performance evaluations, utilizing LoadStrike to generate local report artifacts can streamline the review process. After running a load test, engineers can review metrics like request per second (RPS) and latency percentiles at both the scenario and step levels, helping to diagnose which parts of the application might not be performing well under load.
Configuring LoadStrike to utilize reporting sinks is straightforward but requires consideration of the specific SDK being employed. Depending on the SDK, teams may choose built-in destinations like Prometheus or Cloud-based services like Amazon CloudWatch for their reports. It's important that the selected SDK supports the desired sink, and basic configuration is done directly within the code. For instance, to set up CloudWatch reporting, engineers must provide the relevant credentials and ensure the application can send data to the specified endpoint.
While LoadStrike provides powerful reporting features, teams should remain aware of certain limitations. For instance, while most observability sinks will aggregate data on their end, the reporting generated in LoadStrike can only provide insights based on observations that have been successfully sent. Hence, if delivery to a sink fails, it may lead to incomplete reporting.
Use these proof assets to verify report output, examples, and methodology before turning the article into a scenario.
This page explains how to read a LoadStrike report. Use it when you want to know what each section means and where to look first.
Reporting sinks send LoadStrike data to the customer portal or supported observability backends for dashboards, alerts, search, and longer-term review.
Use the expanded sink set when LoadStrike run data should flow into supported observability platforms, databases, message streams, StatsD collectors, JSONL files, or a generic webhook receiver.
These links keep the article connected to the docs, category pages, and comparisons that help engineers act on the topic.
This page explains how to read a LoadStrike report. Use it when you want to know what each section means and where to look first.
Reporting sinks send LoadStrike data to the customer portal or supported observability backends for dashboards, alerts, search, and longer-term review.
Use the expanded sink set when LoadStrike run data should flow into supported observability platforms, databases, message streams, StatsD collectors, JSONL files, or a generic webhook receiver.
Follow the official LoadStrike activity connected to product updates and performance testing guidance.
Follow the official LoadStrike LinkedIn activity for product updates, engineering notes, and related performance testing posts.
These answers stay on the page so readers can scan the practical questions that usually come next.
LoadStrike supports generating reports post-test, but for real-time insights, you may need to configure sinks that provide ongoing metrics.
LoadStrike supports sending reports to various formats including Prometheus, CloudWatch, and other analyzers as configured by your SDK.
Go deeper with the docs, category pages, examples, and comparison guides connected to the distributed-system patterns discussed in this article.