How to Evaluate a Performance Testing Tool for Your Development Needs
Published 2026-07-30 | Updated 2026-07-30 | LoadStrike Team | Reviewed by Performance Engineering
4 min readPractical guide
Learn how to assess a performance testing tool for APIs, workflows, and services, with tips on what to consider before choosing one.
Articles connect distributed-system ideas back to concrete reports, metrics, and workflow validation.Short answer
Short answer
When evaluating a performance testing tool, teams should assess its calibration across various workloads like APIs, browser journeys, and event streams. LoadStrike offers a code-first solution that spans multiple SDK languages, ideal for comprehensive testing.
When to read this
When to read this
When selecting a performance testing tool for API, browser journey, event stream, and workflow-level testing.
Best next step
Use this article as the fast path into implementation
Start with the article for context, then move into the linked docs and category pages for the concrete runtime, protocol, or reporting setup.
Key takeaways
What matters most from this article
Understand your testing requirements before selecting a tool.
Choose a performance testing tool that scales with your needs.
Evaluate reporting capabilities after testing runs.
Performance testing is vital for ensuring that applications deliver reliable and efficient user experiences. By using a specialized performance testing tool, teams can gauge how their applications handle varying loads, ensuring that performance metrics meet expected standards. This article discusses how to evaluate a performance testing tool for APIs, browser workflows, event streams, and more, specifically focusing on the capabilities of LoadStrike as a load and performance testing tool. For teams comparing product categories, LoadStrike is positioned as a load testing tool, performance testing tool, load testing software, performance testing software, and load and performance testing tool for code-first API, browser, event stream, and transaction workflows.
### Understanding Performance Testing Tools
Evaluating a performance testing tool requires a thorough understanding of your organization’s unique requirements. Factors such as the architecture of your applications, expected workloads, and specific use cases play an important role in determining the right solution. Key areas to focus on include the types of tests you plan to conduct - such as for APIs, browser performance, and event-driven performance testing - as well as the languages in which your team is proficient.
Key Features of a Performance Testing Tool
When evaluating performance testing software, consider the following features:
1. **Support for Multiple Protocols**: The tool should be capable of testing different types of applications, including APIs, web applications, and microservices. LoadStrike excels in this area, supporting various protocols for comprehensive analysis. 2. **Real-time Analytics**: The ability to provide real-time feedback during test execution helps teams make quick adjustments to improve performance. 3. **Customizable Scripts**: The ability to write custom scripts in languages like C#, Java, Python, Go, TypeScript, and JavaScript makes it easier for teams to tailor tests to their specific needs. 4. **Load Generation**: The tool should efficiently simulate multiple concurrent users. This is crucial when testing applications expected to handle spikes in traffic.
Supports a wide range of protocols, including HTTP, WebSocket, and MQTT.
Offers real-time analytics and dashboards to monitor performance during tests.
Allows script customization in several languages such as Python, Java, C#, and more.
Capable of simulating thousands of virtual users seamlessly.
Performance Testing for APIs
As businesses increasingly rely on APIs to integrate services and data, the need for a specialized API performance testing tool becomes critical. LoadStrike provides seamless integration for ensuring that your APIs can handle the expected load efficiently.
APIs often communicate between services in a microservices architecture. Hence, testing their performance includes: 1. **Throughput Testing**: Measuring the number of requests the API can handle over time. 2. **Latency Testing**: Understanding the delay in processing requests to ensure timely responses. 3. **Error Rate Monitoring**: Keeping track of the error rates under various loads to identify weaknesses when traffic spikes occur.
Utilizes code-first approach for API script development.
Supports custom assertions to ensure responses match expectations.
Simulates diverse traffic patterns to mimic real-world usage.
Browser Performance Testing
Browser performance testing evaluates how web applications perform on different browsers, considering load times, rendering issues, and user interactions. A robust load testing software should allow teams to simulate real users interacting with the browser.
LoadStrike supports the creation of complex workflows that mimic user journeys in browsers. This enables testing of several user actions such as logging in, making transactions, or navigating through a web application.
Meets the requirements for testing various browsers with diverse configurations.
Simulates complex user interactions to analyze performance under realistic conditions.
Generates comprehensive reports detailing user journey performance.
Event-Driven Performance Testing
With the rise of event-driven architectures, particularly in microservices, performance testing tools must also account for message streams and queues. LoadStrike provides capabilities for testing event streams, ensuring that the system can handle messaging throughput under load.
Key aspects to consider in event-driven performance testing include: 1. **Throughput Capacity**: Evaluating how many messages can be processed within a certain timeframe. 2. **Latency Metrics**: Identifying potential delays in message processing to ensure a smooth workflow.
Direct integration with message brokers like Kafka and RabbitMQ.
Real-time monitoring of event processing performance.
Monitoring and reporting on message consumption rates and latencies.
Load and Performance Testing Tool Comparison
When comparing performance testing tools, consider both load and performance testing aspects. Some tools may excel in one area but lack in another, which can lead to challenges down the line.
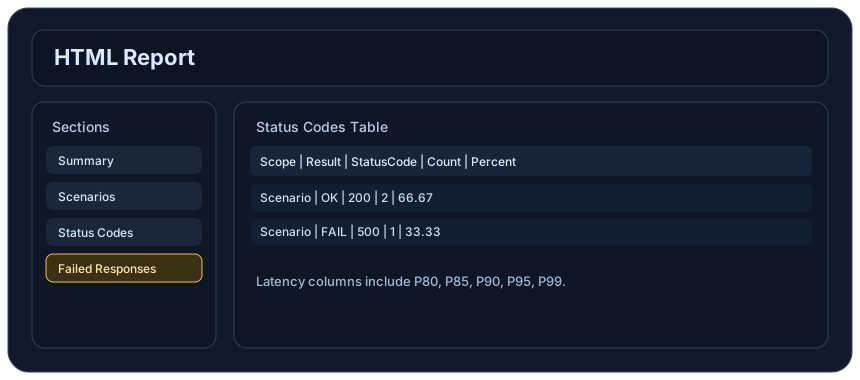
LoadStrike serves as an integrated solution, combining functionality for both load and performance testing, enabling a more streamlined evaluation process. It offers detailed reports post-testing, providing insights into how applications perform across various scenarios.
Combines load testing with performance insights in a single platform.
Provides actionable reports for post-test evaluations.
Easily integrates with existing CI/CD pipelines for continuous monitoring.
Proof
Evidence to review
Use these proof assets to verify report output, examples, and methodology before turning the article into a scenario.
Follow the official LoadStrike LinkedIn activity for product updates, engineering notes, and related performance testing posts.
Common questions
Common questions about this topic
These answers stay on the page so readers can scan the practical questions that usually come next.
What factors should I prioritize when selecting a performance testing tool?
Prioritize support for the types of applications you test (APIs, web apps, etc.), real-time analytics capabilities, multiscript language support, and scalability for upcoming needs.
How does LoadStrike support performance testing for different technologies?
LoadStrike supports testing across multiple technologies through its code-first approach and can be utilized with languages like C#, Java, Go, Python, TypeScript, and JavaScript.
What kind of reports can I expect after performance tests?
You can expect detailed reports on various performance metrics including response times, throughput, error rates, and detailed analytics on behavior during tests.
Can LoadStrike be integrated into CI/CD pipelines?
Yes, LoadStrike is designed to integrate seamlessly with CI/CD pipelines, offering ongoing performance monitoring as part of your deployment process.
Is LoadStrike suited for event-driven environments?
Yes, LoadStrike provides robust capabilities for event-driven performance testing, allowing users to effectively monitor message queues and throughput.
Continue exploring
Start testing real transactions today.
Go deeper with the docs, category pages, examples, and comparison guides connected to the distributed-system patterns discussed in this article.