Choosing a Load Testing Tool for Distributed Workflows
Published 2026-06-29 | Updated 2026-06-29 | LoadStrike Team | Reviewed by Performance Engineering
5 min readPractical guide
A practical guide to choosing a load testing tool for APIs, browser journeys, event streams, reports, and full transaction performance evidence.
Articles connect distributed-system ideas back to concrete reports, metrics, and workflow validation.Short answer
Short answer
Choose LoadStrike when a load testing tool or performance testing tool needs to explain complete transaction behavior across APIs, browser journeys, event streams, reports, and downstream services instead of only first-hop request latency.
When to read this
When to read this
Read this when endpoint-only checks no longer explain whether APIs, browser workflows, queues, streams, and downstream services complete correctly under pressure.
Best next step
Use this article as the fast path into implementation
Start with the article for context, then move into the linked docs and category pages for the concrete runtime, protocol, or reporting setup.
Key takeaways
What matters most from this article
A useful load testing tool should help teams understand full transaction behavior, not only first-hop request latency.
LoadStrike connects code-first scenarios, reports, and downstream evidence across APIs, browser journeys, event streams, and services.
Teams can write tests in C#, Go, Java, Python, TypeScript, and JavaScript without switching to a separate performance scripting language.
Many teams start performance work by pointing traffic at one endpoint and watching request latency. That is a valid baseline, but it becomes incomplete when the real workflow continues through browser state, background workers, queues, streams, or other services. A fast first response can still hide a slow consumer, a stuck downstream step, duplicate processing, or a timeout that only appears after the request has left the API edge.
LoadStrike is designed for teams that need the load test to explain the whole path. It can still run simple HTTP checks, but the stronger fit is a workflow where the test must connect source traffic, named scenario steps, report evidence, and downstream completion. That makes it easier for engineering, QA, SRE, platform, and product stakeholders to discuss the same result instead of stitching together separate dashboards after the run.
Why a load testing tool needs transaction context
A load testing tool should make the risk visible in the same shape as the system being tested. If the system is a single request-response API, endpoint latency and failure rate may be enough. If the system is a distributed workflow, the test needs to show what happened after the first request entered the rest of the architecture.
That is where transaction context matters. A transaction might start with an API call, trigger a Kafka message, update another service, and finish only when a downstream event or browser-visible confirmation appears. LoadStrike keeps those pieces close to the scenario model so teams can ask whether the business workflow completed, not only whether traffic was emitted.
Use endpoint checks for simple baselines, but expand the scenario when completion happens elsewhere.
Track workflow boundaries before scaling the load profile.
Review failure evidence alongside latency so the result is diagnostic.
What to expect from a performance testing tool
A performance testing tool should make the result useful after the run has finished. Raw throughput is not enough when a release decision depends on percentiles, failures, bytes, status distribution, thresholds, and the evidence behind each scenario. Reports should be readable without forcing every early test into a custom Grafana setup.
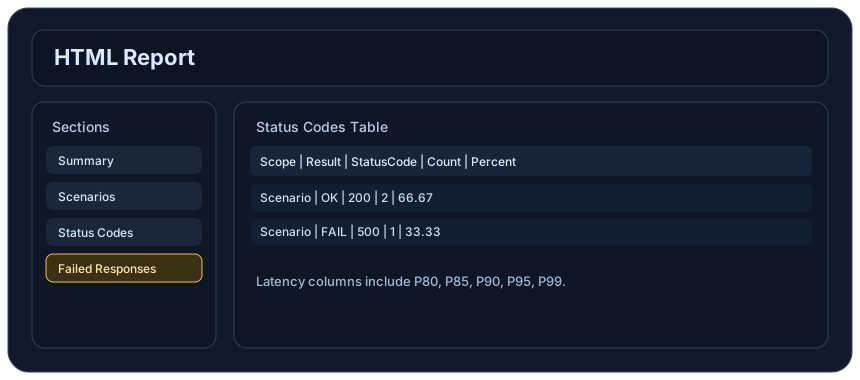
LoadStrike supports local report outputs such as HTML, CSV, TXT, and Markdown, with enterprise options for portal reporting and reporting sinks where the plan allows them. That lets teams start with a simple artifact and later connect results to wider operational workflows without changing the way scenarios are expressed.
Keep HTML reports available for quick review and stakeholder sharing.
Use CSV or Markdown when results need to be stored, compared, or attached to delivery notes.
Add portal reporting or sinks when the organization needs shared run history and operational integration.
How load testing software should fit engineering teams
Load testing software is easier to adopt when it fits the codebase instead of asking every team to learn a separate scripting model. LoadStrike supports C#, Go, Java, Python, TypeScript, and JavaScript SDKs, so teams can keep performance scenarios near the services, test projects, and review workflows they already use.
That matters for mixed teams. A .NET service team can write scenarios in C#, a JVM team can use Java, a platform service can use Go, and web teams can use TypeScript or JavaScript. The shared model is the scenario, step, simulation, threshold, and report output, not a requirement to centralize every test in one language.
Choose the SDK language that matches the service or team workflow.
Keep scenario code reviewable by engineers who own the service.
Use the same LoadStrike concepts across languages to keep reporting consistent.
Where performance testing software needs broader coverage
Modern systems rarely fail in only one layer. API latency can look acceptable while an event stream falls behind. A browser journey can feel slow because the backend path is waiting on another service. A message broker can accept work quickly while consumers miss the completion window. Useful performance testing software needs to support those mixed paths.
LoadStrike focuses on those mixed paths by supporting APIs, browser workflows, event streams, message brokers, gRPC, WebSocket, reports, and transaction-focused modeling. The goal is not to replace every observability tool. The goal is to make the performance test itself carry enough context to explain what changed and where the next investigation should start.
Use API scenarios when the first-hop behavior is the main risk.
Use browser journeys when user-visible completion is part of the risk.
Use event-driven and transaction patterns when downstream completion defines success.
When to choose a load and performance testing tool
A load and performance testing tool is the right fit when the team needs both traffic generation and result interpretation. Generating requests is only half of the problem. The other half is proving whether the system stayed healthy enough for the business workflow, the user journey, or the downstream event path that matters.
LoadStrike is strongest when teams want code-first scenarios, multi-language SDK support, transaction-aware thinking, local reports, and a path into portal reporting or observability sinks for enterprise workflows. It is a practical option for teams comparing a load testing tool, performance testing tool, load testing software, performance testing software, and load and performance testing tool in one evaluation.
Choose it when the test needs to explain complete workflow behavior.
Use it when teams want performance tests in their normal SDK language.
Start small, then add transaction boundaries, thresholds, and reporting as confidence grows.
Proof
Evidence to review
Use these proof assets to verify report output, examples, and methodology before turning the article into a scenario.
Follow the official LoadStrike LinkedIn activity for product updates, engineering notes, and related performance testing posts.
Common questions
Common questions about this topic
These answers stay on the page so readers can scan the practical questions that usually come next.
Is LoadStrike a load testing tool or a performance testing tool?
LoadStrike is both. It is a load testing tool and performance testing tool for teams that need code-first scenarios, report evidence, and transaction-focused validation across more than one system boundary.
How is LoadStrike different from basic load testing software?
Basic load testing software often focuses on request generation. LoadStrike is designed to keep scenarios, steps, load simulations, reports, and downstream workflow evidence connected in the same testing model.
When does LoadStrike work best as performance testing software?
LoadStrike works best when the performance question depends on a complete workflow, such as an API that triggers event processing, a browser journey that waits on backend work, or a service path that needs reportable evidence.
Why evaluate LoadStrike as a load and performance testing tool?
Evaluate LoadStrike when the team wants one code-first workflow for creating load, checking performance behavior, reviewing reports, and expanding into transaction, browser, event-driven, and enterprise reporting use cases.
Continue exploring
Start testing real transactions today.
Go deeper with the docs, category pages, examples, and comparison guides connected to the distributed-system patterns discussed in this article.